In prior articles and in a recent webinar, I’ve covered the use of AI for UEFI and OS kernel trace analysis. This is a groundbreaking and novel approach for code coverage research, with many applications and potential use cases: at-scale bug triaging, codebase vulnerability scans, firmware/OS performance optimization, and many others. In this article, the first of a series, I’ll chronicle my journey learning the underlying technology of LLMs, and how that leads to a working prototype for massive trace analysis.
We’ll start at the beginning…how did this concept come about, and step-by-step how to do this independently, if you’d like to follow in these footsteps. A knowledge of basic x86 architecture, UEFI, Windows and Linux internals, and LLM technologies will help in understanding, but as usual I’ll write for beginners.
@IvanRouzanov and I were speaking one day, and the topic of Intel Processor Trace (Intel PT) came up. For those who may be unfamiliar with it, this is a debugging feature, inherent in Intel CPUs, that allows for near-real-time instruction execution trace. For a short description, the following article is a good reference: Using ChatGPT on the Windows Secure Kernel with Intel Processor Trace. For a fuller description of Intel PT, have a look at the eBook here (note: requires registration on the ASSET website): Guide to Intel Debug and Trace. And finally, this Prelude Security paper by Matt Hand, Connor McGarr and others shows how Intel PT can be used in cybersecurity: Closing the Execution gap: Hardware-Backed Telemetry for Detecting Out-Of-Context Execution.
Ivan and I discussed some of the inherent power of Intel PT, and also some of its limitations: it can trace millions of lines of executed code at a super-granular level, but consuming that massive amount of raw data and deriving actionable insights is a slog. Unless you have a deep understanding of, for example, x86 architecture and Windows internals, looking for a bug or vulnerability in all that code takes a seasoned engineer with decades of experience. And doing visual analysis – with pareto charts, histograms, scatter plots, and the like – on this quantity of data requires custom code that doesn’t really exist.
As an example, look at this excerpt of Intel PT code, captured in the Windows kernel, to get an idea:
FFFFF8037EAA9434 483B2B       cmp         rbp,[rbx]                                -FFFFF8037EAA9437 726A         jc       ::ntkrnlmp.KeQueryCurrentStackInformationEx+1b3
FFFFF8037EAA94A3 B001         mov         al,01                                    FFFFF8037EAA94A5 EBA2         jmp         ::ntkrnlmp.KeQueryCurrentStackInformationEx+159
FFFFF8037EAA9449 488B5C2440   mov         rbx,[rsp+40]
FFFFF8037EAA944E 488B6C2448   mov         rbp,[rsp+48]
FFFFF8037EAA9453 488B742450   mov         rsi,[rsp+50]
FFFFF8037EAA9458 4883C420     add         rsp,00000020
FFFFF8037EAA945C 415F         pop         r15
FFFFF8037EAA945E 415E         pop         r14
FFFFF8037EAA9460 5F           pop         rdi
FFFFF8037EAA9461 C3           retn
FFFFF8037EAA9CF8 84C0         test        al,al                                    -FFFFF8037EAA9CFA 741A         je          ::ntkrnlmp.KeCheckStackAndTargetAddress+56
FFFFF8037EAA9CFC 483B5C2440   cmp         rbx,[rsp+40]
Do you get the picture? There is meaning here, but it’s not visual, and it is difficult to comprehend except by subject-matter experts. And this is just over a dozen lines of assembly language code. Some of our largest Intel PT captures exceeded 300 million lines of code. And we are just getting started.
It struck Ivan and I that, although this amount of data was beyond human comprehension, AI might be able to give us insights. And that’s how this journey began.
Our first step was to use a commercially available, closed-source LLM and GPT, and we picked ChatGPT 4o. At the time of this writing, this is the most advanced reasoning model. And we started simply; we just collected a bunch of Intel PT, and fed it into the model, to see what it could make of it.
The results were surprisingly good, but not perfect. The following articles cover in-depth reports on the good and not-so-good results:
AI analysis of Intel Processor Trace from ENABLEJTAGBREAK to Windows’ first SMI
Using LLMs to analyze Hyper-V Register State and Instruction Trace
Using ChatGPT on Windows Secure Kernel with Intel Architectural Event Trace
Using ChatGPT on Windows Secure Kernel with Intel Processor Trace
This research went on for several months, as we worked with the model and learned how to interact with it to get the best results. Through much trial and error, we learned to spot the more obvious errors/hallucinations and correct them; for example, even though ChatGPT’s knowledge base included the renowned and deeply technical Intel Software Developers Manual, its training introduced errors: it made basic mistakes like misinterpreting MSR addresses. Over time, it seemed that the accuracy of its analysis improved.
Our project culminated in a webinar that was presented on July 15, 2025 (note: requires registration):
Advanced Threat Analysis and Reverse Engineering using AI, IDA, and the SourcePoint JTAG Debugger

After much experimentation, it became obvious that we were bumping into a ceiling in terms of ChatGPT’s ability to hold all of the trace data in memory, and thus accurately triage the source of the Windows Blue Screen of Death (BSOD) that we induced. Collecting and analyzing huge amounts of Intel PT was exceeding even the most capable closed-source, commercial models. To do better, there needed to be a means of training the model to learn from previous traces, to enhance its accuracy for analyzing specific trace contexts; for example, that of UEFI, versus Windows (the normal kernel, secure kernel, and userland applications), versus other code.
It was at this point that I connected with @ArthurRasmusson, the creator of Paged Attention over RDMA. I’ll delve into this technology in a future article in the series, but if you’re interested, I’d recommend reviewing his article Lessons Learned Scaling LLM Training and Inference with Direct Memory Access (DMA): Part 1. And if you find that article fascinating, even better is his video presentation at GTC 2025. The essence of his recent work is that we need to supercharge LLM inferencing with massive amounts of paged virtual memory if we’re ever going to analyze massive codebases.
It was for this reason that I decided to dive into exploring the development of a model trained specifically to analyze traces for Windows. Although using a closed-source model would probably be more performant in the short-term, I decided to start with an open-source model, run locally, as this represents the ultimate in flexibility, and the cost is free. And being a future optimist, I felt that AI’s capabilities, especially given Arthur’s work, will soon get this kind of power into almost everyone’s hands.
A short aside while on this topic: although I’m currently doing my research on a low-end workstation equipped with a 16-thread AMD Ryzen 7 1700X CPU, 16 GB RAM, NVIDIA GeForce GTX 1060 with 6GB VRAM (I know, it’s pretty lightweight), I’ll eventually migrate to Google Colab (https://colab.research.google.com/) where I’ll have free access to a 16GB GPU, for more heavy lifting. And even better, Arthur steered me towards an enthusiast kit – it’s only about $40K, but I can dream…. Building a16z’s Personal AI Workstation with four NVIDIA RTX 6000 Pro Blackwell Max-Q GPUs.
Thus began the learning process….
As a starting point, I acquired a couple of texts recommended by ChatGPT:
Hands-On Large Language Models by Jay Alammar and Maarten Grootendorst (O’Reilly). Copyright 2024 Jay Alammar and Maarten Peter Grootendorst, ISBN: 978-1-098-15096-9:
And Programming Massively Parallel Processors by Wen-mei W. Hwu, David B. Kirk and Izzat El Hajj (Morgan Kaufman). Copyright 2023 Elsevier, Inc, ISBN: 978-0-323-91231-0:
Reading these gave me a much better deeper understanding of how LLMs work. I’d recommend them both highly.
Next up was to study how custom LLMs are created, with the intent to optimize the model for trace analysis of UEFI and Windows code on x86 targets. This necessitated a much deeper dive into LLM architecture than was covered in the July webinar. It’s still a work-in-progress, but I’ll describe it step by step.
There are numerous online references on how to run LLMs locally, but the one I started with was Learn Ollama in 15 Minutes – run LLM Models Locally for FREE, by Tech with Tim. You can watch the video, or follow along with my steps below – I’ll elaborate on a few things that Tim glosses over as I walk through it.
Ollama allows you to run any of a slew of LLMs locally. Go to ollama.com and download, install and run the application. Tim says that that running the app just starts ollama up in the background, but on my Windows PC the application does in fact launch, and displays the following screen:
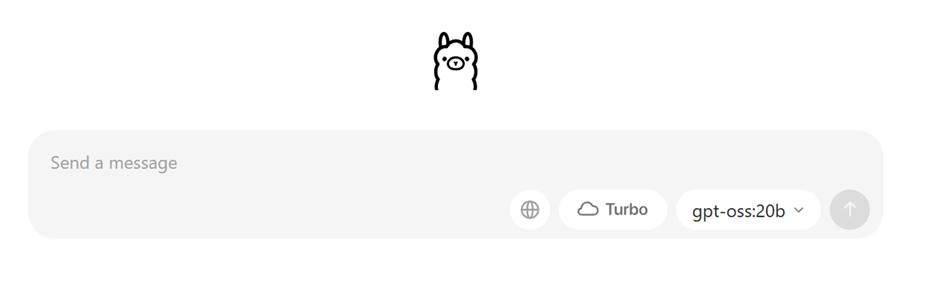
Now, if you do indeed send a message, it will first install the gpt-oss:20b LLM. This is the open-weight, open-source model by OpenAI (the creators of ChatGPT). Note that the “20b” suffix indicates that this is the 20 billion parameter model, and you’ll need in excess of 16GB RAM and quite a lot of disk storage to run this model. If you go to www.github.com/ollama/ollama, you’ll see the general statement near the bottom of the abbreviated Model Library table:
You should have at least 8 GB of RAM available to run the 7B models, 16 GB to run the 13B models, and 32 GB to run the 33B models.
So, unless you have tons of RAM and storage, don’t just enter a message right at the beginning. I did. You’ve been warned. 😊
Also, one thing I needed to do was to move the model repository off my C: drive, for lack of space. The default is in C:\users\<your user name>\.ollama. Change it by setting a new Environment Variable under System variables, OLLAMA_MODELS to D:\ollama\models, or your new directory of choice. And then restart your computer for good measure.
Download the model you want from that GitHub library (in this case I picked llama2) by opening a CMD window and typing in:
>ollama run llama2
Note that it took about 60 seconds for the llama2 prompt to appear, on my computer. It’s pretty slow – hopefully your mileage will be better.
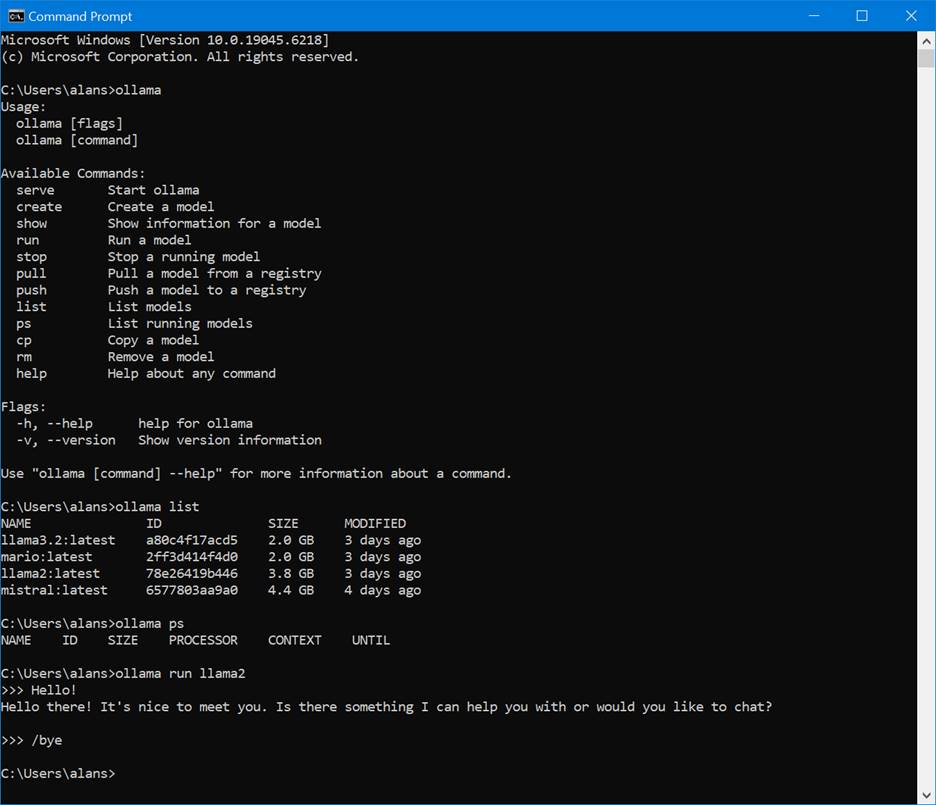
Here’s what you’ll see if you poke around with some of the commands available:
Microsoft Windows [Version 10.0.19045.6218]

(c) Microsoft Corporation. All rights reserved.

C:\Users\alans>ollama

Usage:

  ollama [flags]

  ollama [command]

Available Commands:

  serve       Start ollama

  create      Create a model

  show        Show information for a model

  run         Run a model

  stop        Stop a running model

  pull        Pull a model from a registry

  push        Push a model to a registry

  list        List models

  ps          List running models

  cp          Copy a model

  rm          Remove a model

  help        Help about any command

Flags:

  -h, --help      help for ollama

  -v, --version   Show version information

Use "ollama [command] --help" for more information about a command.

C:\Users\alans>ollama list

NAME               ID              SIZE      MODIFIED

llama3.2:latest    a80c4f17acd5    2.0 GB    3 days ago

mario:latest       2ff3d414f4d0    2.0 GB    3 days ago

llama2:latest      78e26419b446    3.8 GB    3 days ago

mistral:latest     6577803aa9a0    4.4 GB    4 days ago

C:\Users\alans>ollama ps

NAME    ID    SIZE    PROCESSOR    CONTEXT    UNTIL

C:\Users\alans>ollama run llama2

>>> Hello!

Hello there! It's nice to meet you. Is there something I can help you with or would you like to chat?

>>> /bye

C:\Users\alans>
Now, I’m going to need to access the LLM programmatically, for this project; and this is made easy with Ollama as it exposes an HTTP API on localhost. I’ll be using Python for this purpose.
It’s a good idea to run:
>ollama serve
to see the requests to the HTTP server. Cool. I like to keep this CMD window open, as it’s educational to see the traffic. Here’s a subset:
time=2025-08-24T11:04:29.536-05:00 level=INFO source=routes.go:1318 msg="server config" env="map[CUDA_VISIBLE_DEVICES: GPU_DEVICE_ORDINAL: HIP_VISIBLE_DEVICES: HSA_OVERRIDE_GFX_VERSION: HTTPS_PROXY: HTTP_PROXY: NO_PROXY: OLLAMA_CONTEXT_LENGTH:4096 OLLAMA_DEBUG:INFO OLLAMA_FLASH_ATTENTION:false OLLAMA_GPU_OVERHEAD:0 OLLAMA_HOST:http://127.0.0.1:11434 OLLAMA_INTEL_GPU:false OLLAMA_KEEP_ALIVE:5m0s OLLAMA_KV_CACHE_TYPE: OLLAMA_LLM_LIBRARY: OLLAMA_LOAD_TIMEOUT:5m0s OLLAMA_MAX_LOADED_MODELS:0 OLLAMA_MAX_QUEUE:512 OLLAMA_MODELS:D:\\ollama\\models OLLAMA_MULTIUSER_CACHE:false OLLAMA_NEW_ENGINE:false OLLAMA_NEW_ESTIMATES:false OLLAMA_NOHISTORY:false OLLAMA_NOPRUNE:false OLLAMA_NUM_PARALLEL:1 OLLAMA_ORIGINS:[http://localhost https://localhost http://localhost:* https://localhost:* http://127.0.0.1 https://127.0.0.1 http://127.0.0.1:* https://127.0.0.1:* http://0.0.0.0 https://0.0.0.0 http://0.0.0.0:* https://0.0.0.0:* app://* file://* tauri://* vscode-webview://* vscode-file://*] OLLAMA_SCHED_SPREAD:false ROCR_VISIBLE_DEVICES:]"

time=2025-08-24T11:04:29.609-05:00 level=INFO source=images.go:477 msg="total blobs: 11"

time=2025-08-24T11:04:29.611-05:00 level=INFO source=images.go:484 msg="total unused blobs removed: 0"

time=2025-08-24T11:04:29.613-05:00 level=INFO source=routes.go:1371 msg="Listening on 127.0.0.1:11434 (version 0.11.6)"

time=2025-08-24T11:04:29.614-05:00 level=INFO source=gpu.go:217 msg="looking for compatible GPUs"

time=2025-08-24T11:04:29.614-05:00 level=INFO source=gpu_windows.go:167 msg=packages count=1

time=2025-08-24T11:04:29.615-05:00 level=INFO source=gpu_windows.go:214 msg="" package=0 cores=8 efficiency=0 threads=16time=2025-08-24T11:04:29.944-05:00 level=INFO source=types.go:130 msg="inference compute" id=GPU-c0775bb2-6cc3-5e88-49c8-afbe7c2f34d9 library=cuda variant=v12 compute=6.1 driver=12.8 name="NVIDIA GeForce GTX 1060 6GB" total="6.0 GiB" available="5.1 GiB"

time=2025-08-24T11:04:29.944-05:00 level=INFO source=routes.go:1412 msg="entering low vram mode" "total vram"="6.0 GiB" threshold="20.0 GiB"

llama_model_loader: loaded meta data with 25 key-value pairs and 291 tensors from D:\ollama\models\blobs\sha256-f5074b1221da0f5a2910d33b642efa5b9eb58cfdddca1c79e16d7ad28aa2b31f (version GGUF V3 (latest))

llama_model_loader: Dumping metadata keys/values. Note: KV overrides do not apply in this output.

llama_model_loader: - kv   0:                       general.architecture str              = llama

llama_model_loader: - kv   1:                               general.name str              = Mistral-7B-Instruct-v0.3

llama_model_loader: - kv   2:                          llama.block_count u32              = 32

llama_model_loader: - kv   3:                       llama.context_length u32              = 32768

llama_model_loader: - kv   4:                     llama.embedding_length u32              = 4096

llama_model_loader: - kv   5:                  llama.feed_forward_length u32              = 14336

llama_model_loader: - kv   6:                 llama.attention.head_count u32              = 32

llama_model_loader: - kv   7:              llama.attention.head_count_kv u32              = 8

llama_model_loader: - kv   8:                       llama.rope.freq_base f32              = 1000000.000000

llama_model_loader: - kv   9:     llama.attention.layer_norm_rms_epsilon f32              = 0.000010

llama_model_loader: - kv  10:                          general.file_type u32              = 15

llama_model_loader: - kv  11:                           llama.vocab_size u32              = 32768

llama_model_loader: - kv  12:                 llama.rope.dimension_count u32              = 128

llama_model_loader: - kv  13:                       tokenizer.ggml.model str              = llama

llama_model_loader: - kv  14:                         tokenizer.ggml.pre str              = default

llama_model_loader: - kv  15:                      tokenizer.ggml.tokens arr[str,32768]   = ["<unk>", "<s>", "</s>", "[INST]", "[...

llama_model_loader: - kv  16:                      tokenizer.ggml.scores arr[f32,32768]   = [0.000000, 0.000000, 0.000000, 0.0000...

llama_model_loader: - kv  17:                  tokenizer.ggml.token_type arr[i32,32768]   = [2, 3, 3, 3, 3, 3, 3, 3, 3, 3, 3, 3, ...

llama_model_loader: - kv  18:                tokenizer.ggml.bos_token_id u32              = 1

llama_model_loader: - kv  19:                tokenizer.ggml.eos_token_id u32              = 2

llama_model_loader: - kv  20:            tokenizer.ggml.unknown_token_id u32              = 0

llama_model_loader: - kv  21:               tokenizer.ggml.add_bos_token bool             = true

llama_model_loader: - kv  22:               tokenizer.ggml.add_eos_token bool             = false

llama_model_loader: - kv  23:                    tokenizer.chat_template str              = {{ bos_token }}{% for message in mess...

llama_model_loader: - kv  24:               general.quantization_version u32              = 2

llama_model_loader: - type  f32:   65 tensors

llama_model_loader: - type q4_K:  193 tensors

llama_model_loader: - type q6_K:   33 tensors

print_info: file format = GGUF V3 (latest)

print_info: file type   = Q4_K - Medium
Cool.
Now that the server is running, it’s time to send some requests to it via Python code.
The following code (sample_request.py) is a modified example from Tim’s video:
import requests

import json

# Set up the base URL for the local Ollama API

url = "http://localhost:11434/api/chat"

# Define the payload (your input prompt)

payload = {

    "model": "mistral",  # Replace with the model name you're using

    "messages": [{"role": "user", "content": "What is the PL/I programming language?"}]

}

# Send the HTTP POST request with streaming enabled

response = requests.post(url, json=payload, stream=True)

# Check the response status

if response.status_code == 200:

    print("Streaming response from Ollama:")

    for line in response.iter_lines(decode_unicode=True):

        if line:  # Ignore empty lines

            try:

                # Parse each line as a JSON object

                json_data = json.loads(line)

                # Extract and print the assistant's message content

                if "message" in json_data and "content" in json_data["message"]:

                    print(json_data["message"]["content"], end="")

            except json.JSONDecodeError:

                print(f"\nFailed to parse line: {line}")

    print()  # Ensure the final output ends with a newline

else:

    print(f"Error: {response.status_code}")

    print(response.text)
You’ll need to using the Python pip3 command to install the requests module that’s referred to on the first line of the code:
>pip3 install requests
The code is mostly self-explanatory. In this instance, I’m using the mistral model, asking the question “What is the PL/I programming language?”, and then printing out the results. I kick it off by running in a CMD window:
>python .\sample_request.py
And the output eventually appears:
Streaming response from Ollama:
PL/I (Programming Language One) is a high-level programming language that was developed in the late 1960s and early 1970s as an attempt to combine the features of several existing programming languages, such as COBOL, FORTRAN, and ALGOL. The goal was to create a single language that could be used for a variety of tasks, including business data processing, scientific computing, and systems programming.
PL/I supports a wide range of data types, including integers, floating-point numbers, strings, and complex arrays. It also features a rich set of built-in functions for mathematical operations, string manipulation, and database access. PL/I is often used in mainframe environments, particularly on IBM systems, due to its ability to work with large amounts of data efficiently.
While PL/I was once widely used, it has become less popular over time as other languages have emerged that offer more modern features and ease-of-use. However, it still remains in use in some industries and organizations where it is well-established.
Now, there are ways to avoid writing this much Python code, but for now I’m going to stay at the low-level to understand the internals of these models, as I create my own.
That’s it for now. In the upcoming episodes, I’ll dive deeper into the process whereby Intel PT data is collected, formatted, and the model fine-tuned and made ready for deployment.